

| 1-15.
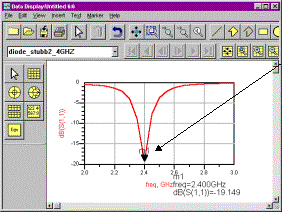
Data display after simulating |

 |
 |
 |
 |
 |
 |
 |
|
| Now
plot S(1,1) in dB |
|||||||
| The
curve should look like this. |
|||||||
| You
get the matching at the |
|||||||
| frequency
for which you |
|||||||
| designed
your single stub. |
|||||||
| (2.4GHz) in this case. |
|||||||
| You
should get another curve |
|||||||
| for 2.6GHz
circuit |
|||||||