

 |
 |
|
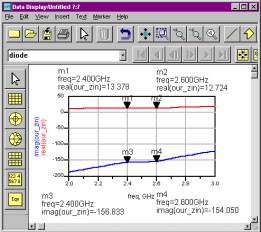
| 1-13. The Zin Plot, |
||
| Add markers at 2.4 GHz and 2.6 GHz on both the curves |
||

 |
 |
 |
 |
 |
|
| This
plot shows the real |
|||||
| and
imaginary parts of Zin |
|||||
| Use
these values to design your |
|||||
| single
stub matching network |
|||||
| and
also plot on the Smith |
|||||
| Chart. |
|||||